Edit chart
Loading graph
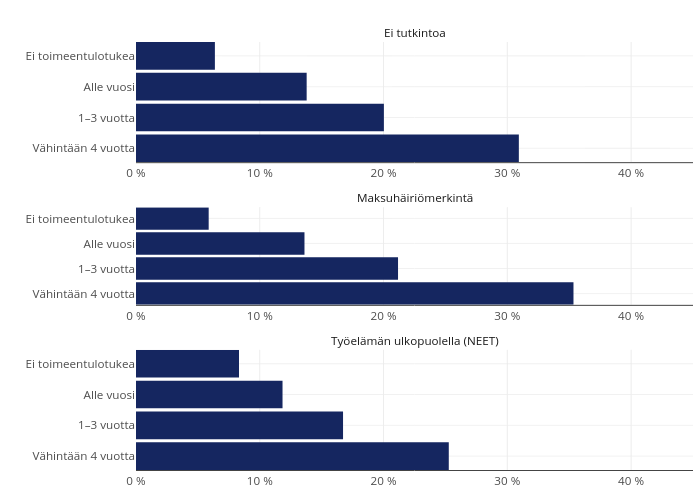
Itla's interactive graph and data is a . The x-axis shows values from 0 to 0.45. The y-axis shows values from 0.55 to 4.45. This visualization has the following annotations: Ei tutkintoa; Maksuhäiriömerkintä; Työelämän ulkopuolella (NEET)